Summary
In my last article, I focused on starting to gain experience with finding and improving performance on the PyMarkdown project using cPython and SnakeViz. In this article, I talk about applying that knowledge and doing more performance tuning on the project.
Introduction
In the last article, I earned first-hand experience in profiling the PyMarkdown project. While getting that learning accomplished, I also managed to get a big performance boost from writing a simple facade in front of the Python logging libraries. That is probably the only simple and big performance boost that I am going to get, so I know I am going to have to start digging to find the more difficult items to optimize. And I am ready for that work!
From experience, I am also aware that not everything I am going to try will work. I was lucky with the logging facade… that was just one big performance issue that was extremely obvious. This effort is still new, so I am hoping that I am still in the honeymoon period. While it is not the same as a political honeymoon period, it does share some characteristics with it. Namely, it is during this period that a lot of the performance improvements are obvious or easy to arrive at. They might entail some work, but there will be a very low failure rate.
Here is hoping that the honeymoon lasts for a while longer!
What Is the Audience for This Article?
While detailed more eloquently in this article, my goal for this technical article is to focus on the reasoning behind my solutions, rather that the solutions themselves. For a full record of the solutions presented in this article, please go to this project’s GitHub repository and consult the commits between 13 Feb 2021 and 20 Feb 2021.
Dipping My Toes Into the Waters of Performance
It was with a lot of nervousness that I started to work on performance improvements to the project. I know from experience that I can easily get lost in improving the execution of an application, and this project is no different. I need to make sure that I focus on keeping this effort timeboxes so that I can get back to getting ready for the initial release without too much of a delay.
In documenting this work, I have tried to keep the explanations to a minimum, but I am also trying to balance that with solid explanations of why I chose that improvement and the thought processes around that decision. Please bear with me as I try and find that balance point between those two competing goals!
Starting At The Beginning
Using cProfile and SnakeViz, I captured information about running the PyMarkdown project over the Markdown pages that comprise this website. This is what I initially saw:

Looking at that information, the two lines that jumped out at me were the first
line, debug, and the fourth line, isEnabledFor. These two functions were both part
of the recent work I did to improve the speed of debugging. As logging was still showing
up high on the list, it was obvious to me that I needed to take another look and see
if I could fine tune it anymore.
After looking at the code, the one line that seemed to me to be the most expensive was:
if self.__my_logger.isEnabledFor(DEBUG):
The way I thought about it, every time that the debug logging method was called, this
function was being called in the base of the Python logging library. While it was okay
to have that happen, I decided that it was too expensive to happen every time that
function was called, and it needed to be rewritten.
To reduce the cost of calling that library function, it was necessary to change the logging requirements of the project to achieve a bit of “wiggle room” to allow for the change to occur. In this situation, the requirement that I changed was the ability to dynamically change the logging level at any time. Because of the way that the PyMarkdown project is setup, it is highly unlikely that anyone will want to change the logging level in the middle of a Markdown file scan. As such, it seemed like it was a good thing to trade off on.
To replace that one line, I started by adding some extra code to the ParserLogger
class as follows:
    __global_count = 0

    def __init__(self, my_logger):
        self.__my_logger = my_logger
        self.__is_info_enabled = self.__my_logger.isEnabledFor(INFO)
        self.__is_debug_enabled = self.__my_logger.isEnabledFor(DEBUG)
        self.__local_count = ParserLogger.__global_count

    def __reset_if_needed(self):
        if ParserLogger.__global_count != self.__local_count:
            self.__local_count = ParserLogger.__global_count
            self.__is_info_enabled = self.__my_logger.isEnabledFor(INFO)
            self.__is_debug_enabled = self.__my_logger.isEnabledFor(DEBUG)

    @staticmethod
    def sync_on_next_call():
        """
        Sync the local instance of the logger on the next call.
        """
        ParserLogger.__global_count += 1
Instead of calling the isEnabledFor function each time, I added some code to
cache the results of calling that function in DEBUG mode.
To keep the ability to change the logging level alive, I added the sync_on_next_call
function to set a class level member variable. Then, instead of calling the
isEnabledFor function, I replaced that line with these lines:
    self.__reset_if_needed()
    if self.__is_debug_enabled:
My hope was that by replacing the library call with the cached values, it would improve performance. But, as with any performance change, the only way to check is to run tests after the change to show any changes. Running those tests again, this is the information that SnakeViz showed:

The results? The total time for debug went from 1.3 seconds in first place to 0.5
seconds in fifth place. The entry for isEnabledFor went from 0.7 seconds in fourth
place to so far down on the list that I did not bother looking for it. It was just the
first improvement, but that was a good one! It took me only minutes to finish up
that change by implementing the same functionality for the INFO related functions, before
moving on to the next change.
Plugin Performance
Before talking about this change, I want to address something important with measuring
performance: the measurements are volatile. Especially with very fine differences
between measurements, it is very to measure the performance of whatever is
being changed without any changes, apply those changes, and then measure the performance
again with the changes. In my case, I get things ready to go, use Git’s stash command
to save the changes, restoring the stash before I take the second set of measurements.
If I had not done that, I would have been very surprised that the time taken for the
debug statement to execute had crept up about 0.15 seconds. I’ll speak about that
more at the end of this section.
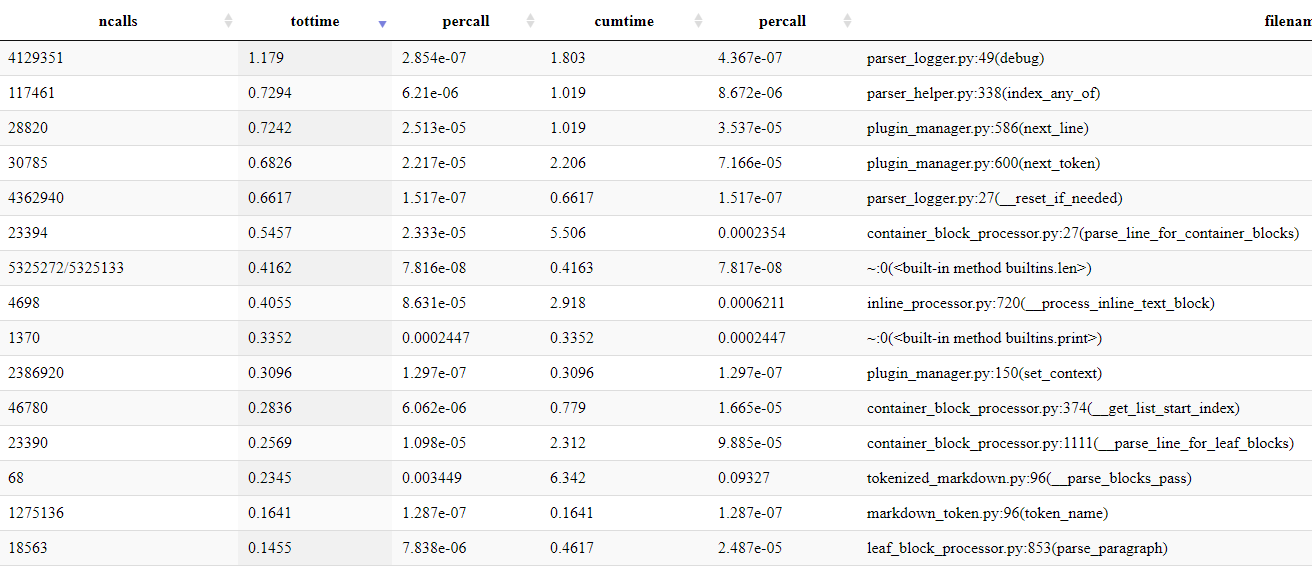
Examining the performance samples, the two lines that struck me as odd were the third line
containing next_line and the fourth line contained next_token. Both these functions
exist as part of the plugin support and I could not think of any existing plugin that
required an examination of both lines and tokens. At the same time, within a given
range, those two duration measurements were equal.1
Given the requirement that PyMarkdown plugins only need to be called when they implement a given function, I did some digging and tested this assignment out:
        self.__is_next_token_implemented_in_plugin = (
            "next_token" in self.__class__.__dict__.keys()
        )
Based on some digging I did, this assignment sets the value of the member variable
__is_next_token_implemented_in_plugin to indicate whether a given plugin
implements a given function, in this case the next_token function. After tests
confirmed that it was working, I added some extra code to the apply_configuration
function:
    if next_plugin.plugin_instance.is_next_token_implemented_in_plugin:
        self.__enabled_plugins_for_next_token.append(next_plugin)
Finally, in the next_token function of the PluginManager class, I changed the
plugin notification code from:
for next_plugin in self.__enabled_plugins:
to:
for next_plugin in self.__enabled_plugins_for_next_token:
The result was that the plugin function next_token was only called when it was
defined in the plugin itself, not in the base class. After repeating this process for
the next_line function, I ran the performance tests again:
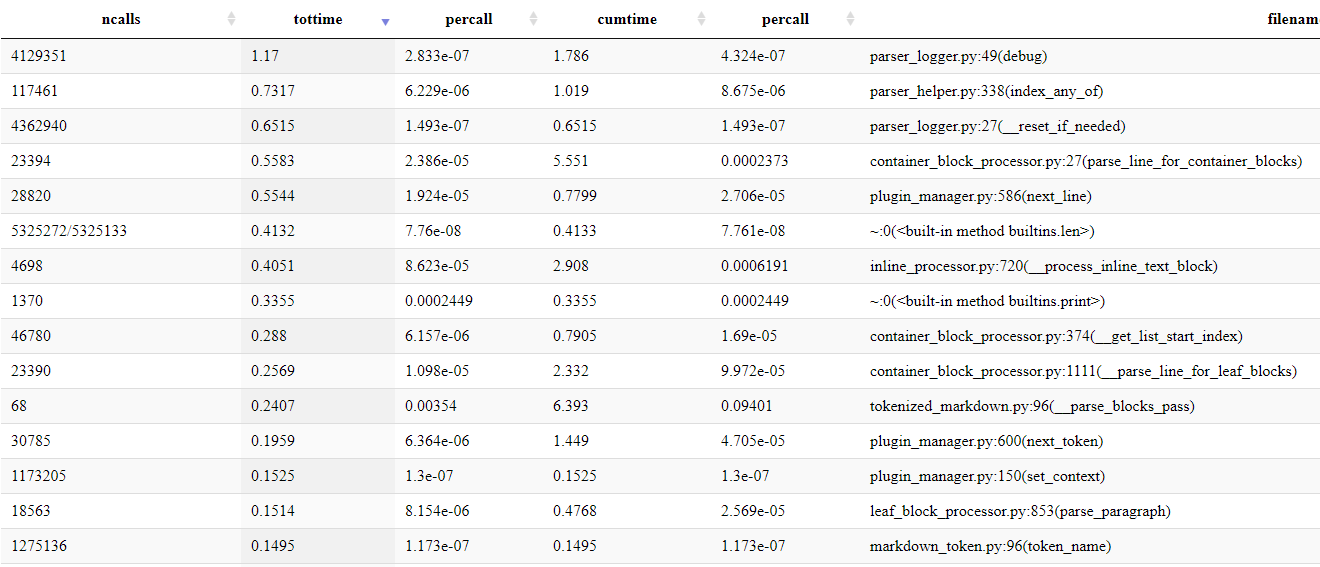
Instead of those values both being called, it now looked like the roughly 5.6 seconds was being split between the two of them. Another good start!
As for the increase in the debug function execution time? I am not sure what
did it, but the total time duration was roughly equal between the before and after
samples, as were the next 2 to 3 items in the sample. That means the process is working!
But if I was only comparing the sample to the previous sample taken under different
circumstances, I may have come to some other conclusion. The key to getting these
good measurements was to ensure I was taking the before and after measurements within
minutes of each other.
Excessive Use of the Len function
Following my now established process, I ran the performance tests again to look for the next item that caught my eye:
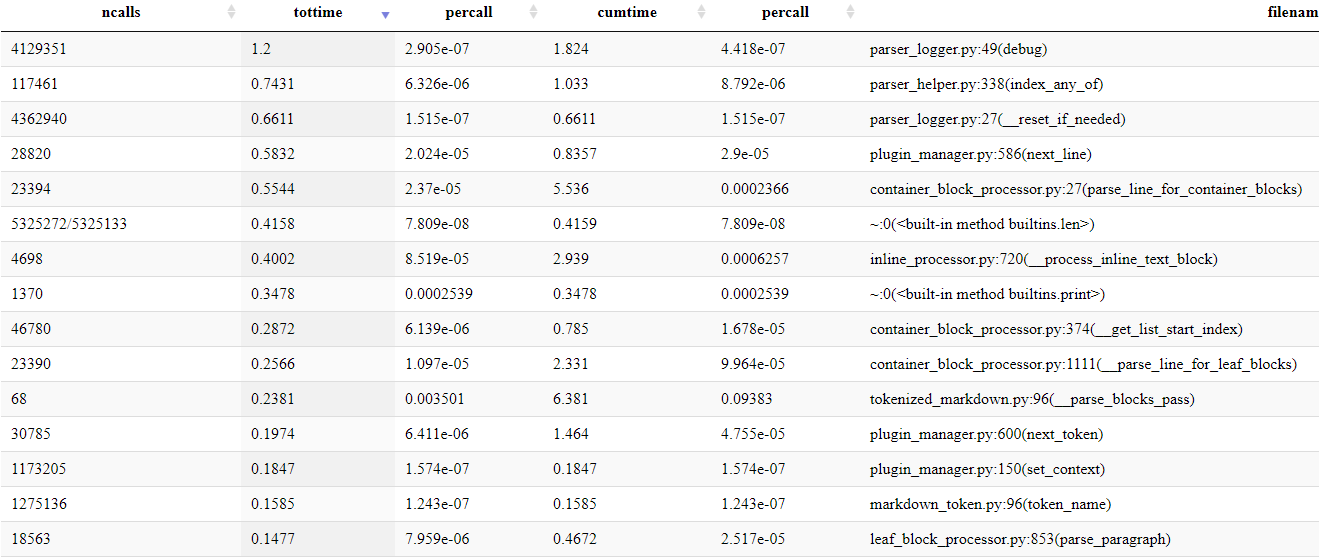
This time, it was the line that includes built-in method builtins.len. Parsing any
kind of language is string intensive, so I did expect this measurement to be high, but
I did not expect it to be that high. Digging into the code, I found a few things
that I thought I could change to make the code perform better.
The first thing that I found were debug statements that included calls to len that
did not provide any additional information. Statements like:
    POGGER.debug("parsed leaf>>$", leaf_tokens)
    POGGER.debug("parsed leaf>>$", len(leaf_tokens))
where the first statement is already implicitly providing the length of the array by simply counting the number of elements displayed in the array’s debug output. By removing the second statement, I was able to make it more performant without changing any information, just the way the information would be obtained in the future. Similarly, there were cases where I was just logging information in the form of the second statement, where the information from the first statement would suffice. Both those changes were easy to look for and make across the code base.
Another change that I did was to cache the results of the len function for a given
string within a single function. There were quite a few cases where I was calling
the len function 2 to 4 times within a function, or more if I called it from within
a loop. In those cases, I found the first place in that function where it was used, say:
if not (string_index < len(string_to_parse):
and replace it with the following code:
    string_to_parse_length = len(string_to_parse)
    if not (
        string_index < string_to_parse_length
With that code tested, I then proceeded to replace every other instance of
len(string_to_parse) inside of that function with string_to_parse_length
before testing again.
That set of changes resulted in many modifications over most of the files in the project, but it was accomplished quickly. Once completed, the performance tests showed the results:
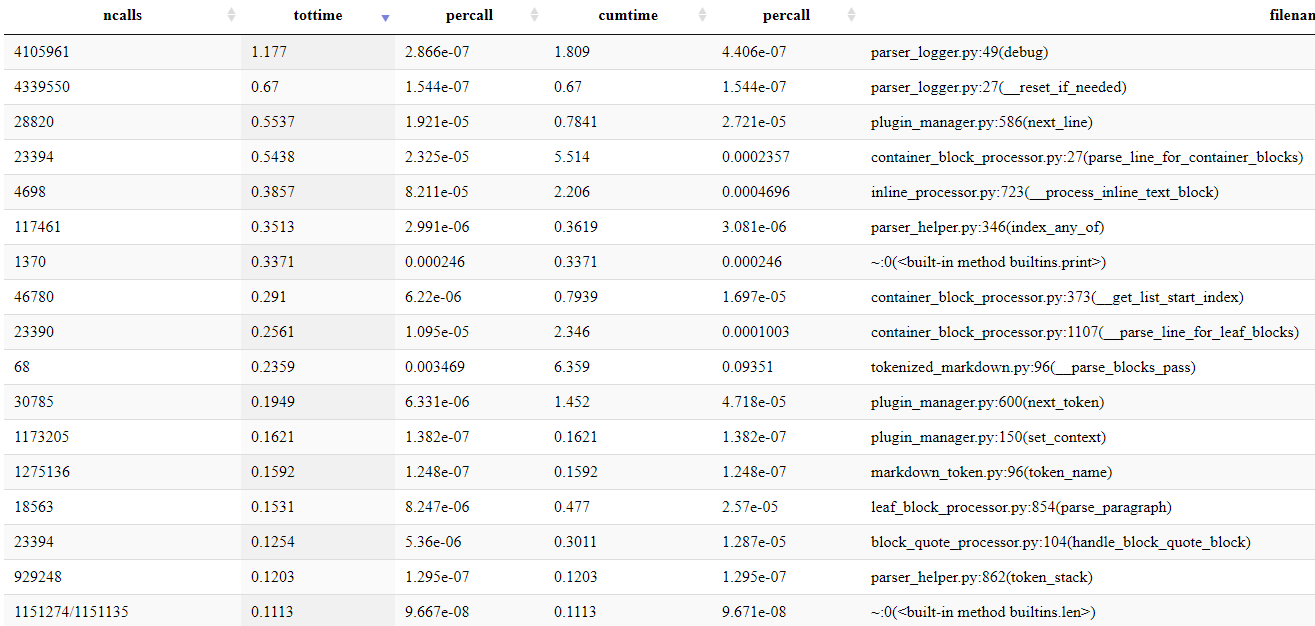
The line that includes built-in method builtins.len went from 6th place at
0.42 seconds to 17th place at 0.11 seconds. At a solid 0.3 second difference, it
was a good optimization!
Going Back To Logging
Performance is not something you can measure once and be done with it. It must be continuously examined again and again to see how the program peforms under different circumstances. When I looked at this set of performance tests:
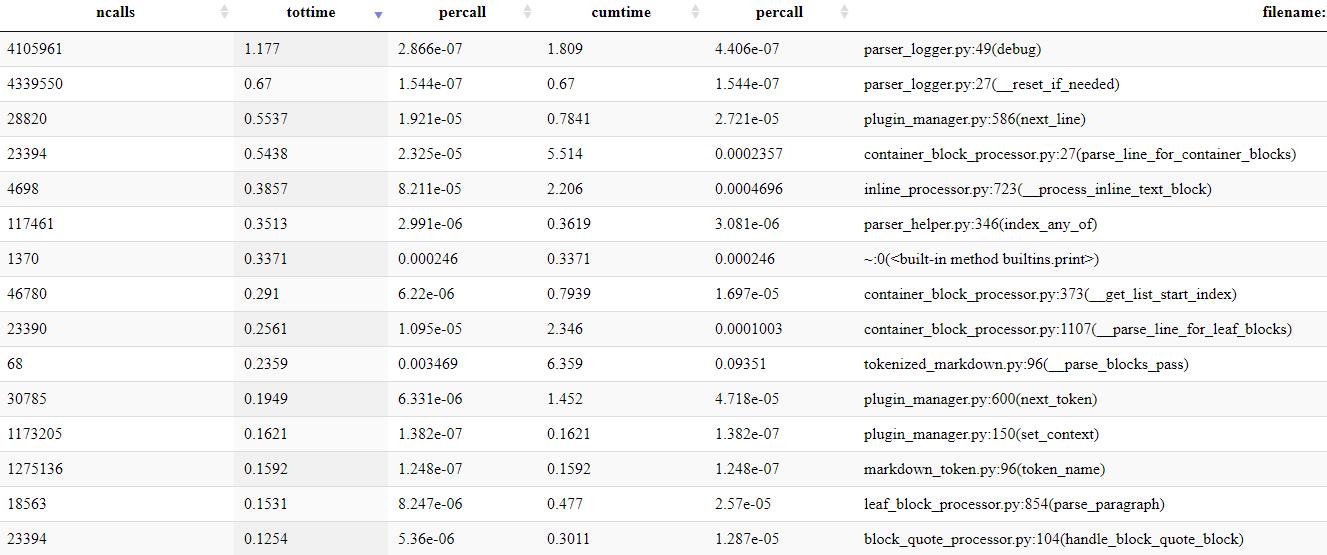
I wondered if I had stopped optimizing the logging code too early. As that code is the most often called code in the project, I decided to spend some extra time looking at it. When I did, I realized that if I traded my Don’t-Repeat-Yourself code for performance on a limited scope, I could rewrite:
self.__reset_if_needed()
as:
        if ParserLogger.__global_count != self.__local_count:
            self.__reset_cache()
By doing this, I was avoiding a function call by performing the same action directly in the function, often referred to as inling. Only in those cases where the counts had changed, did the code need to reset the cache. Given that I was pretty sure that changing logging levels was going to be an extremely rare occurrence, I felt that this was an acceptable trade-off.
This was a very localized change, so it was easy to make and test:
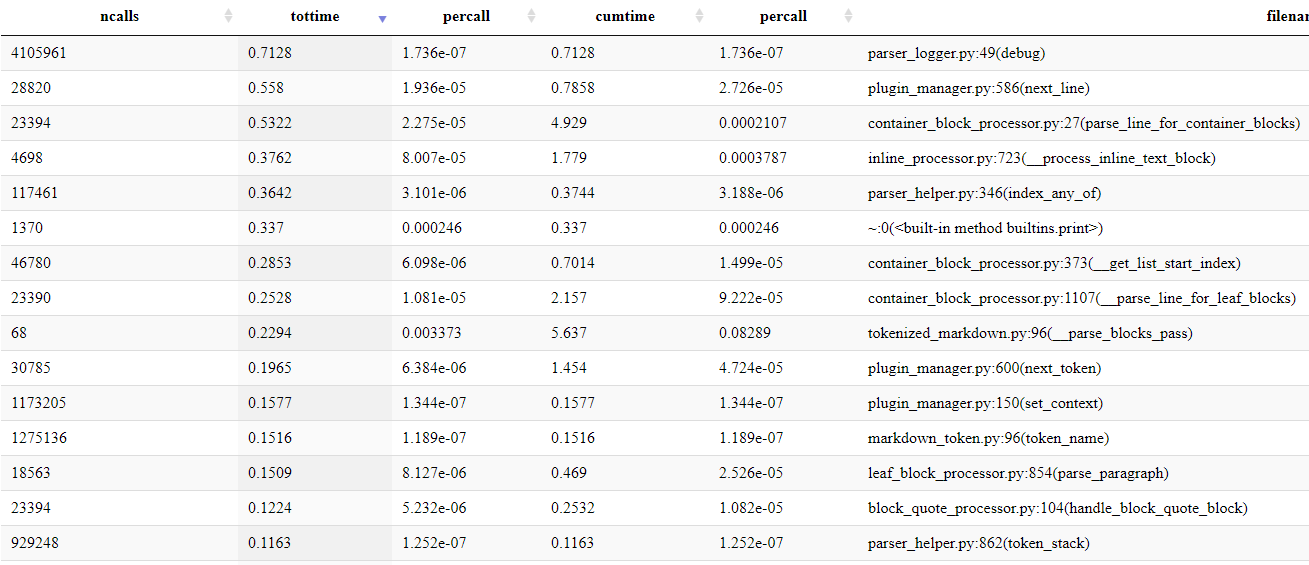
With that small change, I reduced 1.8 seconds of duration between the first two lines with 0.7 seconds of the new first line. That was worth it!
Bending The Rules Is Part Of The Game
Looking at the next set of outputs from the performance tests:
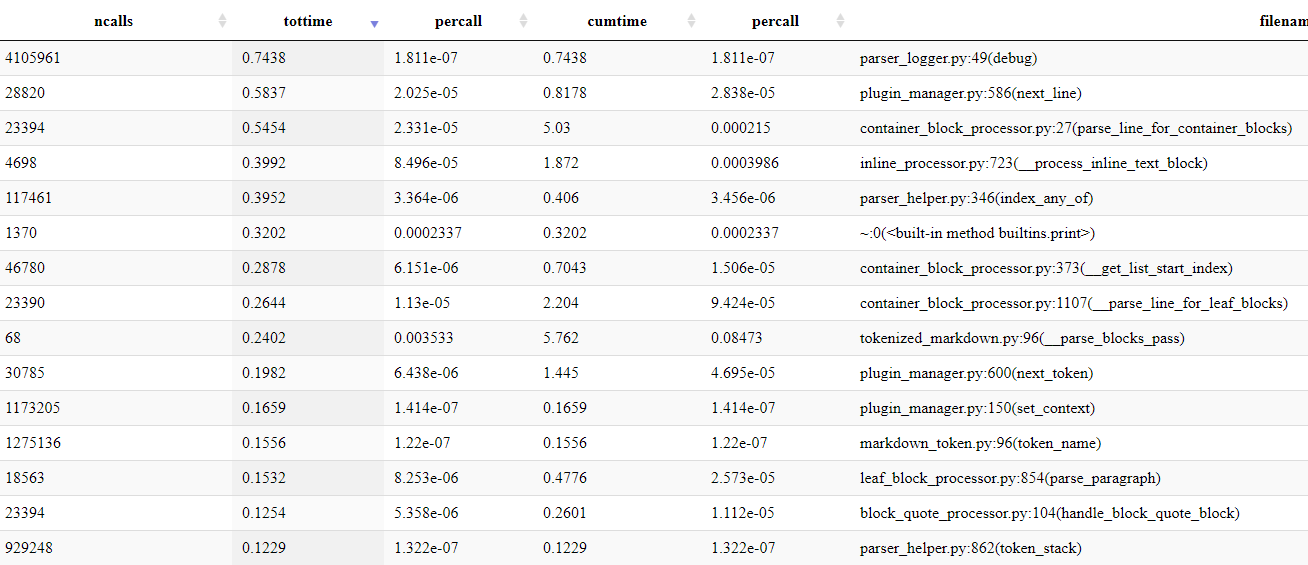
one thing was obvious. I was not going to be able to avoid looking at the
parse_line_for_container_blocks function any longer. But this one function was a tough
one. This is the main function through which all the container processing and leaft
processing gets handled. Without
it, the container block processing wouldn’t be done, and it wouldn’t be handing off the
leaf block processing as designed. This was a pivotal function, but I was not seeing any
obvious places where I could make a good impact on the code’s performance.
Thinking a bit about how I made the requirements trade-offs for the previous items, I started thinking about how I could make a similar trade in requirements here. Unfortunately, nothing was coming to mind at all. That is, until I looked through the function and realized that there was one thing I hadn’t considered: removing the logging.
Now, removing the logging itself would be harmful, as that logging had helped me debug issues quite often, so the cost of outright removing the logging was prohibitively high. It would be like trying to tie your shoes in a knot while wearing a cast on one hand and slinging a yoyo with the other hand. However, I realized that if I commented out the log statements, it would have the same effect as removing the log statements. Also, by commenting out those lines, I kept them in the project so that I could add them back in when I needed them but leave them out during normal operation.
The trade-off here? Time to debug would increase if I needed to uncomment the debug statements. Thinking about it for a bit, I decided that for this function it was a good trade-off and commented out every log statement inside of the function. That resulted in the following results from the performance tests:
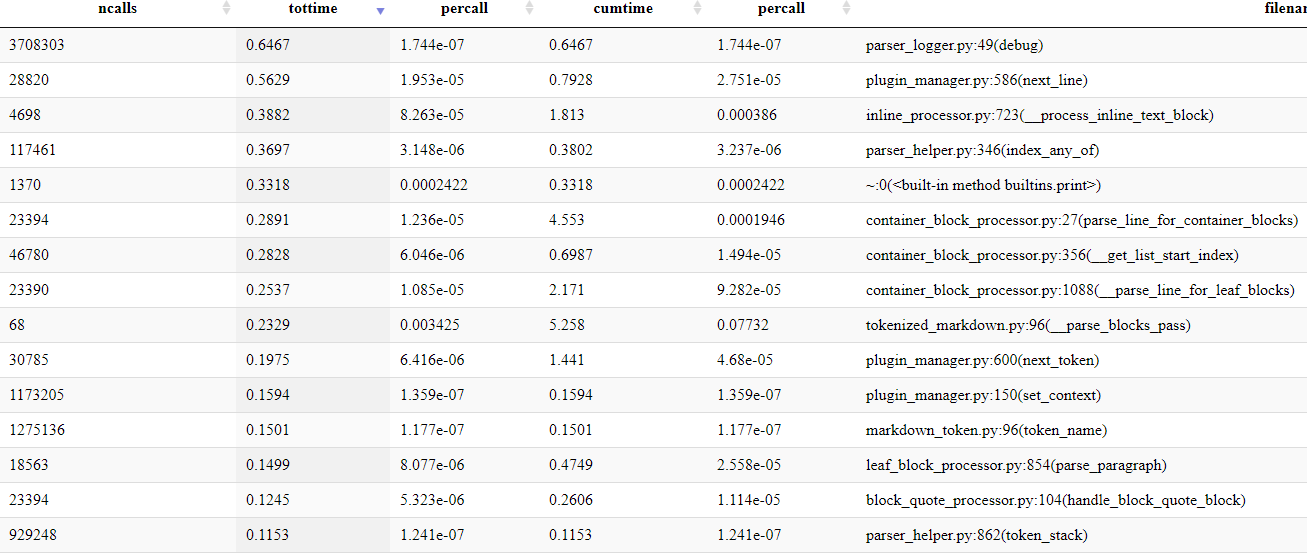
From 3rd place with 0.55 seconds down to 6th pace with 0.29 seconds. At roughly half the previous execution time, it was a good trade-off to make. Granted, it is bending the rules, but in a good way.
There Is A Limit to Bending The Rules
After looking at the current performance test results:
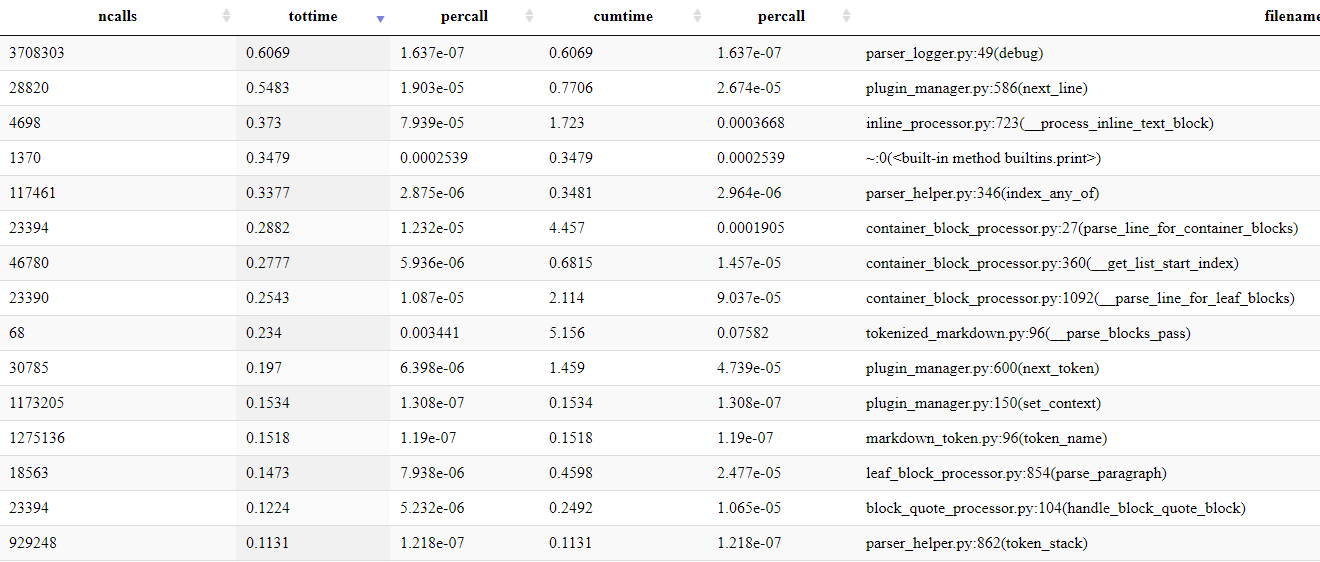
it seemed like it was a good process to try again with the __process_inline_text_block
function. In my mind, I was worried that I was using this manner of performance
improvement too often, and I needed a hard limit. In looking at this method,
through which all inline processing is done, I figured I was still within the limits
that I found acceptable. I was close to what I considered the limit to be, but I
was confident that this change was within that bounds of that limit.
With that, I repeated the commenting process that I used in the last section on this function, with the following results:
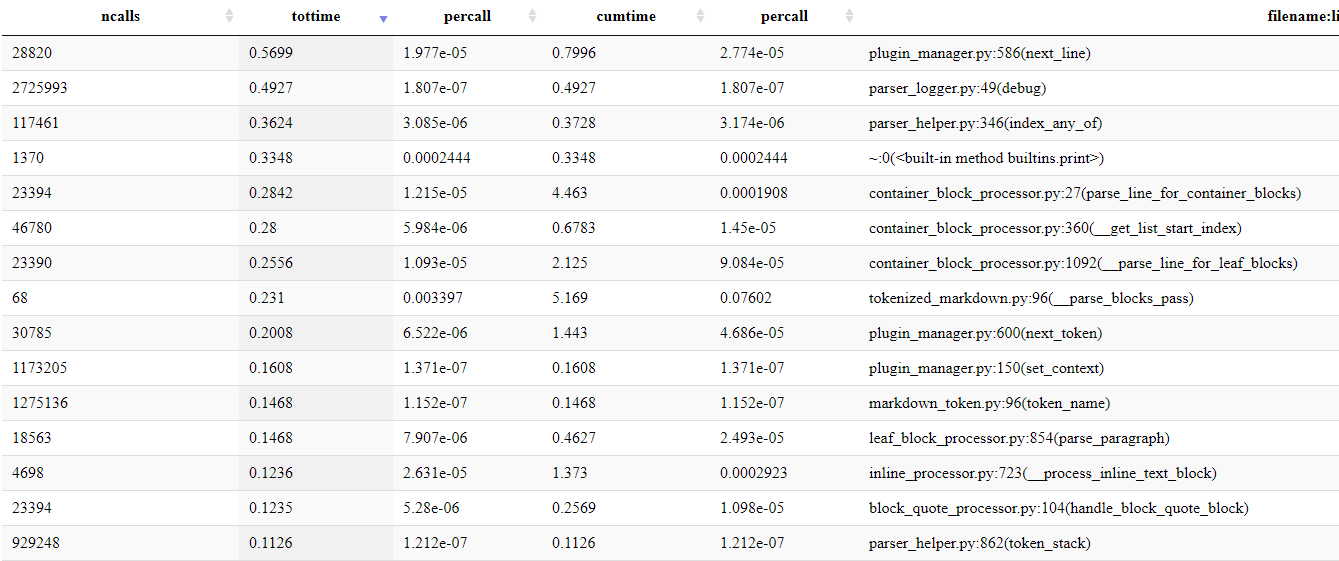
While not as dramatic as before, I dropped the __process_inline_text_block item from
3rd place and 0.37 seconds down to 13th and 0.12 seconds.
Having Some Fun
One of the fun things I love about doing performance testing and improving is that you get to experiment with different approaches to see how they fare. Looking at the latest results:
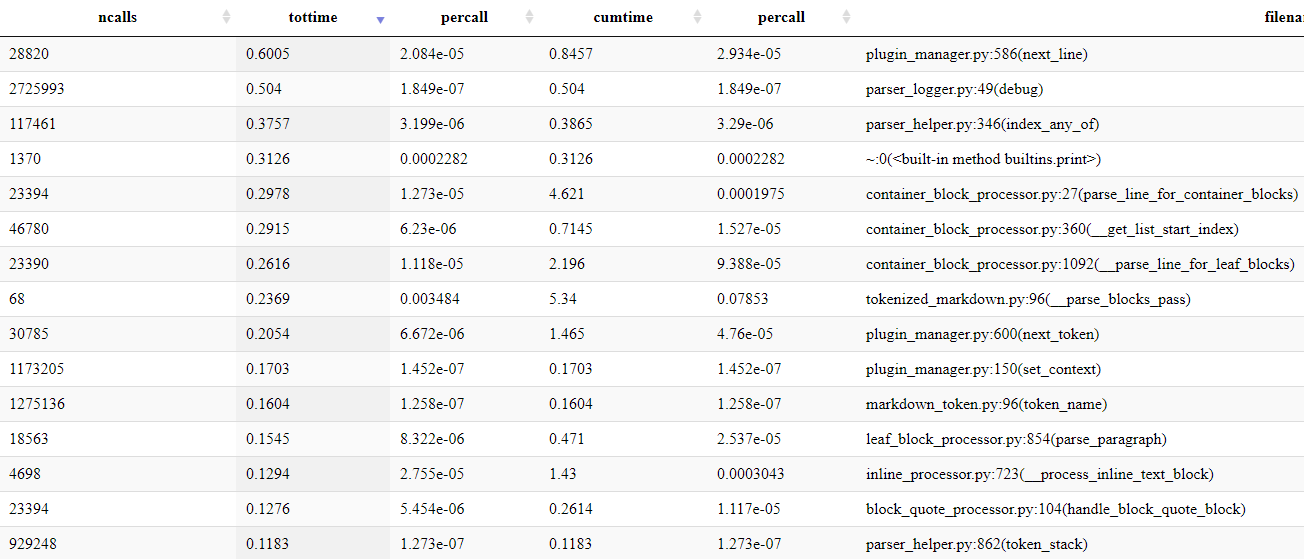
I knew that I was going to have to get creative with the index_any_of function. It is
a simple function but one that is heavily used in the InlineProcessor class. During
the parsing of an inline block, the processor looks ahead to find the character which is
any one of a set of characters that denotes the possible start of an inline sequence.
Hence, the index_any_of is used to find the first instance of any of those characters.
The original version of this function was as follows:
    source_text_size = len(source_text)
    while start_index < source_text_size:
        if source_text[start_index] in find_any:
            return start_index
        start_index += 1
    return -1
Knowing that this enhancement would soon make my to-do list, I had been experimenting on different algorithms on the side, trying to find one that was better than what I had. While I tested four variations that failed, I found one that performed better if the number of characters to find was under 15 characters.
During my reading on performance, one thing that was mentioned frequently was that many
of the Python builtins were more performant than Python code because it was precompiled
and optimized. Taking a hint from that, my wining solution rewrote the above function
to leverage the builtin index as much as possible:
    first_index = -1
    for next_character in find_any:
        found_index = source_text.find(next_character, start_index)
        if found_index != -1:
            first_index = (
                found_index if first_index == -1 else min(first_index, found_index)
            )
            if first_index == 0:
                break
    return first_index
In my simple tests, if I kept the length of the find_any variable to 15
characters or less, it won over the other algorithms. But those “test” results
did not mean anything if the same impact was not present when tested against the
project’s code. So, it was time to test it out on the ‘real’ code:
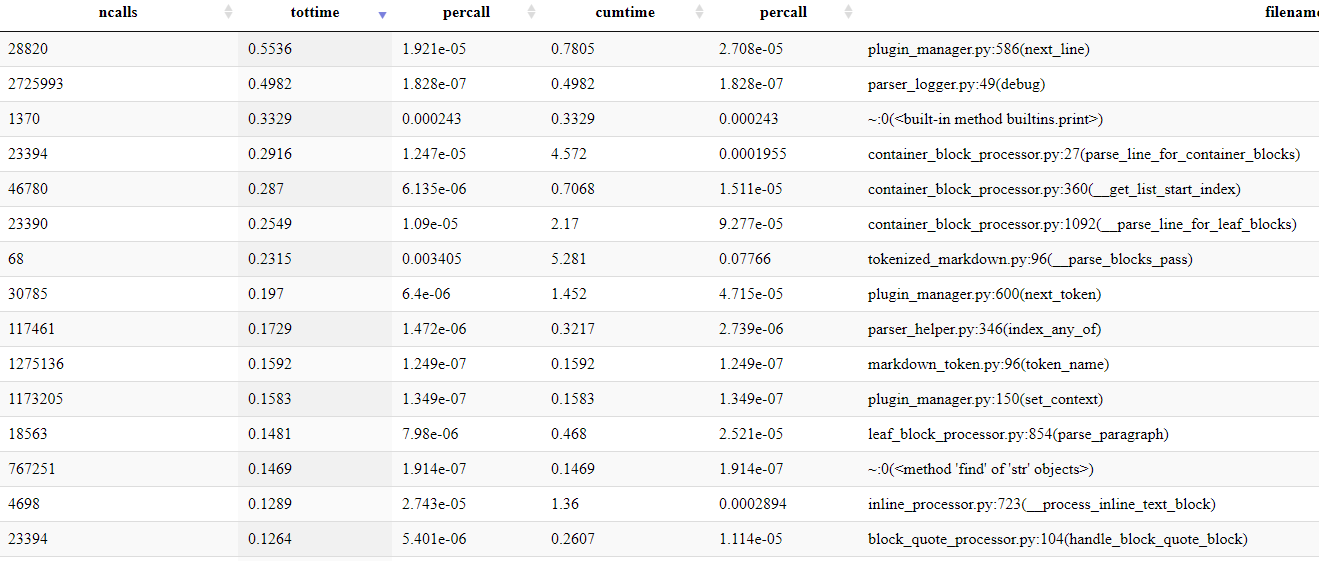
Moving from 3rd place with 3.8 seconds down to 9th place with 1.7 seconds of duration was impressive! With my experience in performance tuning, I wasn’t sure if this was one of those cases where it looked good in simple tests but failed when inserted into the host project. I was glad that it worked well in both situations!
Bending Or Breaking?
Remember back a couple of sections where I said there were times to bend the rules and there were limits to how much you could bend them? It was after looking at these test results:
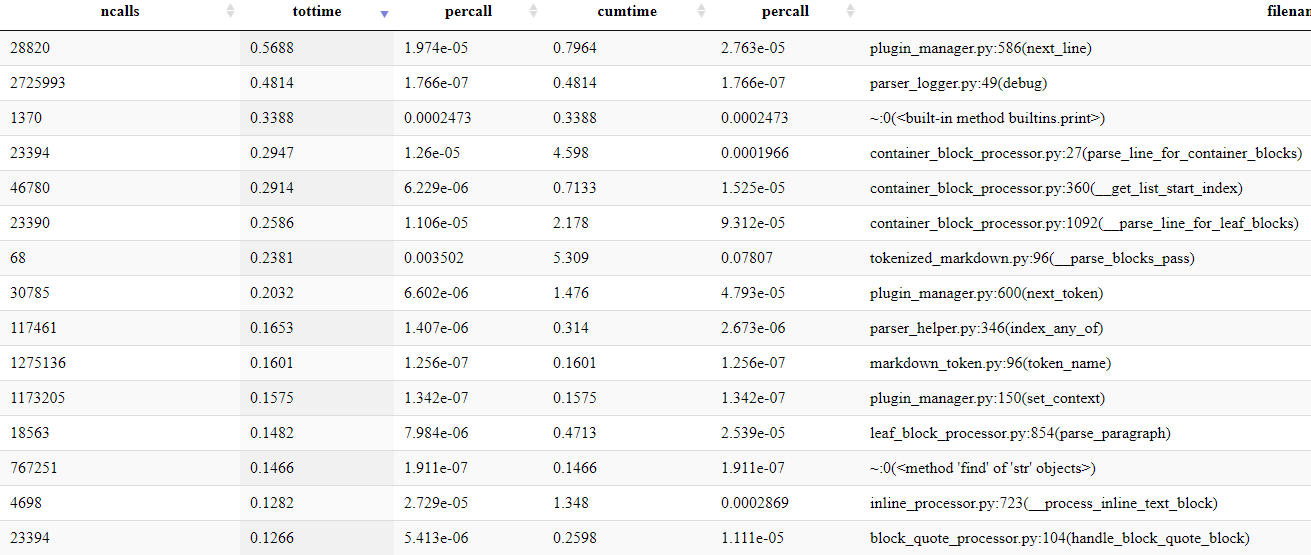
that I looked at the __get_list_start_index. I knew I had to be honest with myself about
which side of that limit line this function was on. The first function that I had
applied that process to was easy to decide on as it was the most heavily trafficked part of
the actual parsing code. It was a no-brainer to reduce the logging in that function. The
second function was not as easy of a decision to make, but as the second most heavily
trafficked function, it made sense.
That left me with trying to figure out where the __get_list_start_index function stood
in that spectrum. It was while I was looking at the code that I realized that I needed
to bump this function’s importance up the chain 1 level. This function was not called
once but twice every time it was needed: once for unordered list block and the second
time for ordered list blocks.
As soon as I realized that fact, the decision was already made in my mind to go forward with commenting out the debug statements. Applying the process, I ran the performance tests and held my breath:
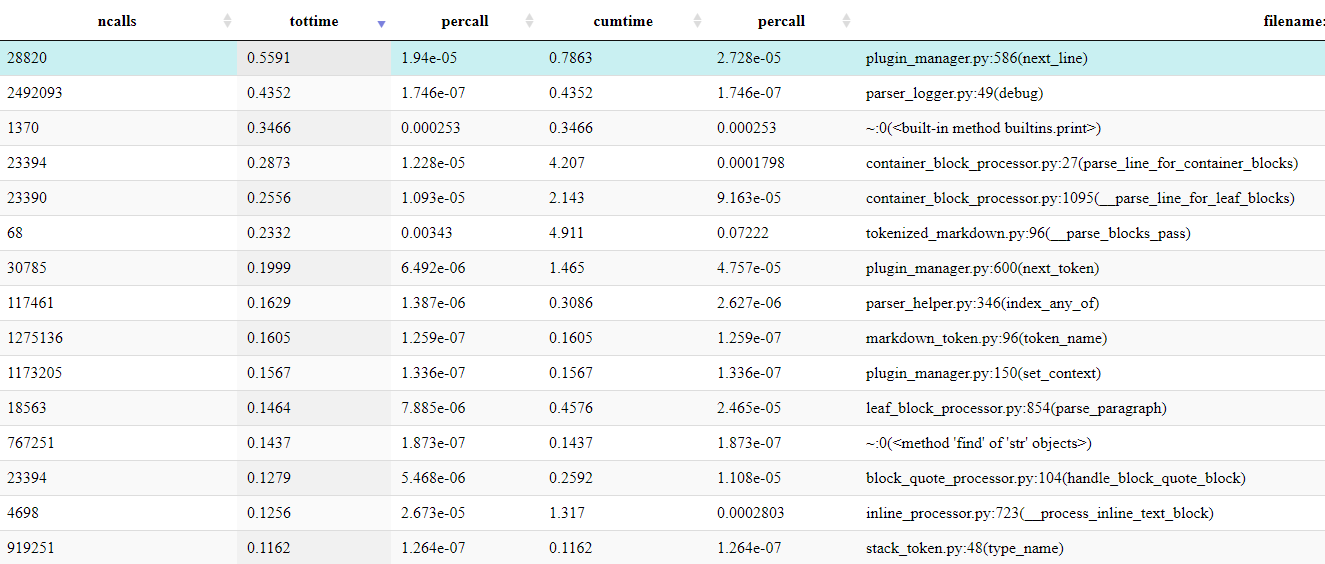
Looking for the __get_list_start_index in the top 15, I did not see it at all. When
I found it, it was down at the 96th position in the table. From the 5th place in the
table with 0.29 second down to 96th place with 0.08 seconds. That was cool.

Is The Honeymoon Over?
With the returns diminishing, as I write this article I am wondering if the honeymoon period for finding “easy” performance fixes is over. I do not know if it is or not, but I do know that I have optimized a lot of the top 10 functions in the list. This means that I am going to have to work harder for less return from here on out. I do have a couple of ideas on how to improve things further, but that is for another article!
What is really evident to me though is that my current snapshot and seconds approach to finding new items to try and optimize is almost hitting its limit. It is becoming harder to figure out what to try and optimize, and whether any changes help the performance. That is something that I am going to have to do some thinking on!
Cleaning Up
While I was poking around the code, there were a handful of things that I wanted to clean up, as usual. When measuring the performance of these changes, most of these changes resulted in a performance improvement on the order of 0.1 or 0.3 seconds over 10 million iterations. But more than that, they just seemed like it made sense to clean these things up for code maintenance reasons.
Return Statements
Honest confession time. I am not perfect. When I am writing code, I get lost in the moment, and write the code that I need to write, knowing I will come back and clean it up later. Sometimes, that is obvious. Take this piece of code:
        if ParserHelper.is_length_less_than_or_equal_to(
            adj_ws, 3
        ) and ParserHelper.is_character_at_index(
            line_to_parse, start_index, BlockQuoteProcessor.__block_quote_character
        ):
            return True
        return False
Yup, I wrote that.2 It took me less than 10 seconds to rewrite it, but it was me that originally wrote that. Not:
        return ParserHelper.is_length_less_than_or_equal_to( adj_ws, 3 ) and \
            ParserHelper.is_character_at_index(line_to_parse, start_index,
                BlockQuoteProcessor.__block_quote_character)
Which would have made much more sense.3 But then, we all do things when we are writing code that we look back on, knowing we can do better. Part of my journey in writing this project is understanding that quality in a project is very iterative. For example, I found a couple more instance of that pattern in the project’s code, but thankfully, not anymore. I am learning to be okay with things like that. I know I sometimes look at the code and go “What was I on when I wrote that?”, but I also accept that it is an artifact of how I work. Focus on the algorithm and clean up the code later. It just happens.
A more frequent find was to find blocks of statements like:
    processed_line += source_text[start_index:]
    POGGER.debug("processed_line>>$<<", processed_line)
    return processed_line
In cases like this, I made sure that the debug statement was not needed and removed it. At that point, I have one statement that adds another string to its value, and another statement that returns it. It was more legible and performant to do this:
return processed_line + source_text[start_index:]
Removing Needless Default Variable Settings
Another frequent find was a block of statements like:
        did_add_definition = False
        if link_name in LinkHelper.__link_definitions:
            {something}
        else:
            {something}
            did_add_definition = True
Looking at those statements now, I realize that I probably added the if block or the
else block after the initial code was written. While that was acceptable during the
building phase of the project, now that I was getting ready to release, I wanted to
clean scenarios like this up.
That is why I refactored the code to be:
        if link_name in LinkHelper.__link_definitions:
            {something}
            did_add_definition = False
        else:
            {something}
            did_add_definition = True
Basically, there is no need to do an assignment to False, only to have the False case
of the if statement set it to True. To me, that is just a useless assignment that
can easily be avoided. Also, from a readability viewpoint, that double assignment is
confusing to read. For me, the = False case stuck in my head in the first example.
In the second example, both = False and = True stuck in my head at the same level.
To me, that just makes sense.
And looking over the code now, I realize I could have just set the variable
did_add_definition to link_name not in LinkHelper.__link_definitions. The learning
continues.
Ternary Statements
I am not sure if everyone loves ternary statements, but I do. For me, these statements are very useful in cleanly encapsulating the setting of a single value depending on a given condition. From my point of view, why type in:
    this_bq_count = 0
    if init_bq is not None:
        this_bq_count = init_bq
when the much shorter:
this_bq_count = 0 if init_bq is None else init_bq
is syntactically the same and more concise?
In all fairness, when I am work on writing the code, I will almost always write it in a long form. The best answer that I can give as to why I do that is that I believe that ternary statements are great for final states, but not so for intermediate states. By leaving the statements in their original long form, I feel more ready to change the conditions and values if needed. However, once those are nailed down, its ternary statements as much as possible!
Single Characters StartsWith and EndsWith
This cleanup was more of a pet peeve than any kind of performance improvement. If possible, I prefer to keep character references and string references separate. Seeing as Python does not have a concept of a single character that is distinct from a string, that is difficult. For me, I feel that being more “honest” about the input allows me to better design algorithms that use those inputs to achieve their goals.
That is why I sent through the code and replaced occurrences of the endswith and
startswith function with their character-based equivalents. That is why I
changed:
remaining_line.endswith(InlineHelper.backslash_character)
to:
remaining_line and remaining_line[-1] ==InlineHelper.backslash_character
While I realize that it might not seem like a big change, to me, it is a more readable and more honest form of the condition.
When In Rome…
Looking around for hints on how to improve performance in Python, I came across a handful of documents that gave good hints on how to be more Pythonic. The best way that I can describe the feeling of these documents is that I need to follow the doctrine: When in Rome, do as the Romans do. Basically, if I want to leverage the power of the Python language, I need to use the features it provides in ways that add clarity and readability to the code.
Because of the nature of this project, there is only one place in the entire project where I found that a common Pythonic concept, list comprehensions, is useful. List comprehensions are very Pythonic, involving the simplification of lists in a very performant manner. I just have not found more than one use for them in the project. Another very Pythonic concept is the returning of multiple values from a function. While trickery can be used in other languages to get some level of the same effect, Python’s first-class support for tuples makes this concept very useful and very easy to use.
A good example of this is when I changed this code:
    adjusted_text_to_parse = position_marker.text_to_parse
    adjusted_index_number = position_marker.index_number
to this code:
    adjusted_text_to_parse, adjusted_index_number = (
        position_marker.text_to_parse,
        position_marker.index_number,
    )
While these statements may look almost the same, I see a large difference in readability. When I read the first example, the first questions that I usually have are around the grouping of those two statements. Are there blank lines before and after to separate them into a group? Are they related to each other? These are some of the questions that I think about when reading code.
The second example takes most of those questions and tosses them out the window. By using that specific grouping, I feel that I invert the questions I ask, reducing them to one question: Is there any reason that any one statement should not be in that group? For me, that is usually a far easier question to answer. In that above case, it is a logical grouping for me as both variables deal with text and the current index into that text. Used at the start of a function, they communicate that those variables are all being set to their initial states.
Of course, there is also a simpler answer: I just think it looks more readable.
What Was My Experience So Far?
The first thing that comes to mind is to answer the question of whether the project is still in the honeymoon period as far as performance tuning goes. As I am still seeing reductions in durations of about 50% and very few experiment failures, I am convinced that I still have at least a little way to go before it ends. I am not sure how far, but there still is some time. But with my desire to get an initial release out and circulating, I know the right decision currently is to focus on items in the issues list that are blocking the release. And that means focusing on those items and not on performance. And I am okay with that.
In terms of finding a balance and getting the project out there, I am feeling good about that too. Yes, I got sidetracked on performance. But honestly, I knew that was going to happen. I want to make the project better, and I know that focusing on performance will increase the usability of the project. I must remember that people can easily focus on performance with no end in sight. Unless I want to succumb to that, I need to make sure I have good solid limits on performance tuning and what is acceptable. And I think I found that.
Through the performance enhancements, I realized something with this round of
enhancements that really had not dawned on me before. Performance, like other parts of
a project, is a requirement that is just as malleable as any other. Some of the
improvements that I made may appear to be tightening screws here and there, but they
were also flexing and bending requirements. Caching logging levels? That was reducing
the requirement to change log levels during program execution. Caching calls to the
len function? That could be seen as reducing the readability of code by centralizing
that call in a location that might not be “correct” for some people. Commenting out
debug statements? That was a clear reduction of the immediate debuggability of those
functions to gain some performance. In each case, it was finding a good balance
between those. I may have “known” it before, but it was cool to understand it enough
at this point to be able to put it into words.
What is Next?
There is one more performance improvement that I will talk about next time, and it is a doozy of one. Other than that, I am focusing on getting all the items in the priority 1 section resolved.
-
If you have ever looked at any polling, they will usually say that a poll is accurate to +/-3%, or something like that. This same principle is usually applied to performance measurements, with similar levels of accuracy. ↩
-
Imagine me doing a face palm when I read that piece of code. ↩
-
Going to try and move on now. Damage done. ↩
Comments
So what do you think? Did I miss something? Is any part unclear? Leave your comments below.